25
SPECIAL REPORT
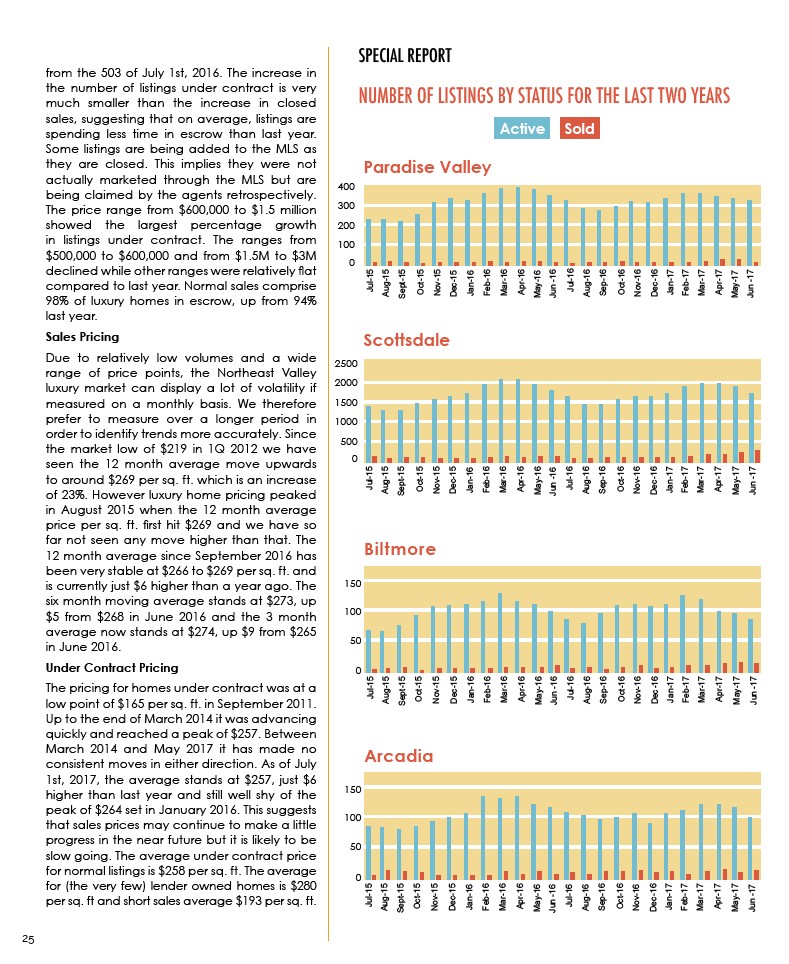
NUMBER OF LISTINGS BY STATUS FOR THE LAST TWO YEARS
Active Sold
from the 503 of July 1st, 2016. The increase in
the number of listings under contract is very
much smaller than the increase in closed
sales, suggesting that on average, listings are
spending less time in escrow than last year.
Some listings are being added to the MLS as
they are closed. This implies they were not
actually marketed through the MLS but are
being claimed by the agents retrospectively.
The price range from $600,000 to $1.5 million
showed the largest percentage growth
in listings under contract. The ranges from
$500,000 to $600,000 and from $1.5M to $3M
declined while other ranges were relatively flat
compared to last year. Normal sales comprise
98% of luxury homes in escrow, up from 94%
last year.
Sales Pricing
Due to relatively low volumes and a wide
range of price points, the Northeast Valley
luxury market can display a lot of volatility if
measured on a monthly basis. We therefore
prefer to measure over a longer period in
order to identify trends more accurately. Since
the market low of $219 in 1Q 2012 we have
seen the 12 month average move upwards
to around $269 per sq. ft. which is an increase
of 23%. However luxury home pricing peaked
in August 2015 when the 12 month average
price per sq. ft. first hit $269 and we have so
far not seen any move higher than that. The
12 month average since September 2016 has
been very stable at $266 to $269 per sq. ft. and
is currently just $6 higher than a year ago. The
six month moving average stands at $273, up
$5 from $268 in June 2016 and the 3 month
average now stands at $274, up $9 from $265
in June 2016.
Under Contract Pricing
The pricing for homes under contract was at a
low point of $165 per sq. ft. in September 2011.
Up to the end of March 2014 it was advancing
quickly and reached a peak of $257. Between
March 2014 and May 2017 it has made no
consistent moves in either direction. As of July
1st, 2017, the average stands at $257, just $6
higher than last year and still well shy of the
peak of $264 set in January 2016. This suggests
that sales prices may continue to make a little
progress in the near future but it is likely to be
slow going. The average under contract price
for normal listings is $258 per sq. ft. The average
for (the very few) lender owned homes is $280
per sq. ft and short sales average $193 per sq. ft.
Paradise Valley
400
300
200
100
0
Nov-15
Dec-15
Jan-16
May-16
Jun -16
Jul-16
Aug-16
Aug-15
Jul-15
Oct-15
Sept-15
Feb-16
Mar-16
Apr-16
Sep-16
Oct-16
Nov-16
Dec-16
Jan-17
Feb-17
May-17
Jun -17
Mar-17
Apr-17
Nov-15
Dec-15
Jan-16
May-16
Jun -16
Jul-16
Aug-16
Aug-15
Jul-15
Oct-15
Sept-15
Feb-16
Mar-16
Apr-16
Sep-16
Oct-16
Nov-16
Dec-16
Jan-17
Feb-17
May-17
Jun -17
Mar-17
Apr-17
Scottsdale
2500
2000
1500
1000
500
0
150
100
50
0
Nov-15
Dec-15
Jan-16
May-16
Jun -16
Jul-16
Aug-16
Aug-15
Jul-15
Oct-15
Sept-15
Feb-16
Mar-16
Apr-16
Sep-16
Oct-16
Nov-16
Dec-16
Jan-17
Feb-17
May-17
Jun -17
Mar-17
Apr-17
Biltmore
Nov-15
Dec-15
Jan-16
May-16
Jun -16
Jul-16
Aug-16
Aug-15
Jul-15
Oct-15
Sept-15
Feb-16
Mar-16
Apr-16
Sep-16
Oct-16
Nov-16
Dec-16
Jan-17
Feb-17
May-17
Jun -17
Mar-17
Apr-17
Arcadia
150
100
50
0