34
SPECIAL REPORT
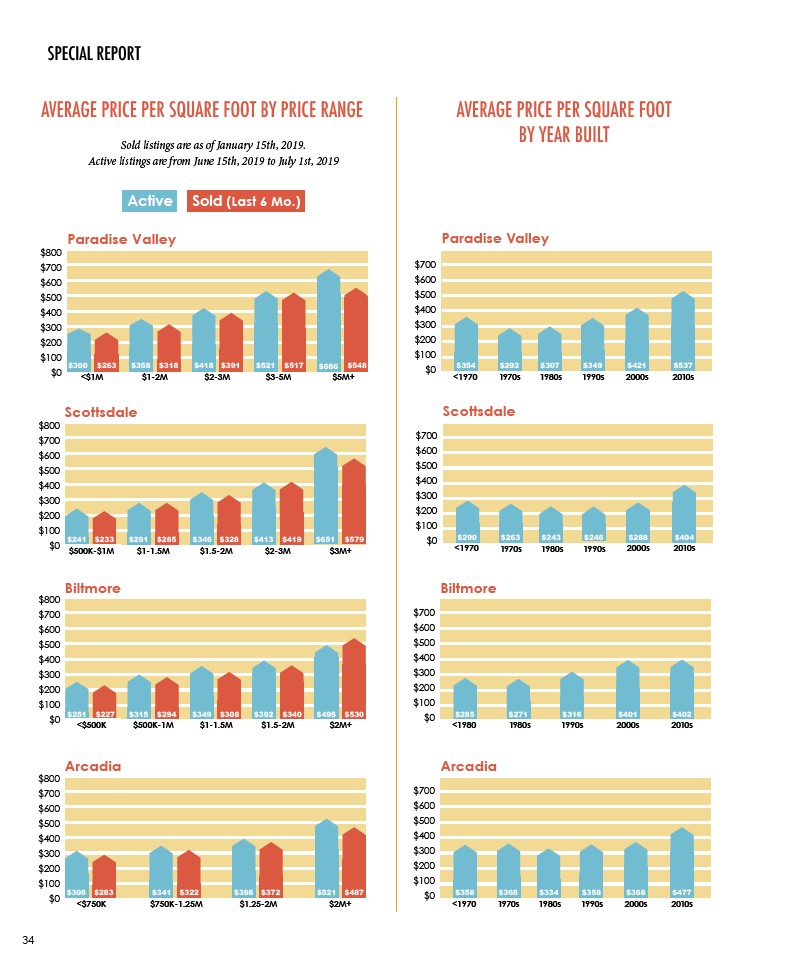
AVERAGE PRICE PER SQUARE FOOT BY PRICE RANGE AVERAGE PRICE PER SQUARE FOOT
Sold listings are as of January 15th, 2019.
Active listings are from June 15th, 2019 to July 1st, 2019
Active Sold (Last 6 Mo.)
BY YEAR BUILT
$800
$700
$600
$500
$400
$300
$200
$100
$300 $358 $318 $418 $391 $521 $517 $686
$0 <$1M $1-2M $2-3M $3-5M $5M+
Scottsdale
$800
$700
$600
$500
$400
$300
$200
$100
$0 $1-1.5M $1.5-2M $2-3M $3M+
$241 $233 $291 $285 $346 $328 $413 $419 $579
$500K-$1M
Biltmore
$800
$700
$600
$500
$400
$300
$200
$100
$0 $251 $227 $315 $294 $349 $308 $392 $495
<$500K
$500K-1M $1-1.5M $1.5-2M $2M+
$530
$800
$700
$600
$500
$400
$300
$200
$100
$341 $322
$0 $750K-1.25M
$398 $372
$1.25-2M
$521 $487
$2M+
Arcadia
$308
<$750K
$283
$700
$600
$500
$400
$300
$200
$100
$0
Paradise Valley
$354 $292 $307 $349
$290 $263 $246
$334
1980s
$358
$316
1990s
$421
$288
$401
$368
2000s
$285 $271
Arcadia
$537
$404
$402
$477
$358 $368
<1970 2010s
1970s
$700
$600
$500
$400
$300
$200
$100
$0
1990s
2000s
Biltmore
<1980 2010s
1980s
$700
$600
$500
$400
$300
$200
$100
$0
1980s 1990s 2000s
Scottsdale
<1970 2010s
1970s
$340
$651
Paradise Valley
$263 $548
$700
$600
$500
$400
$300
$200
$100
$0
1980s 1990s 2000s
<1970 2010s
1970s
$243