33
SPECIAL REPORT
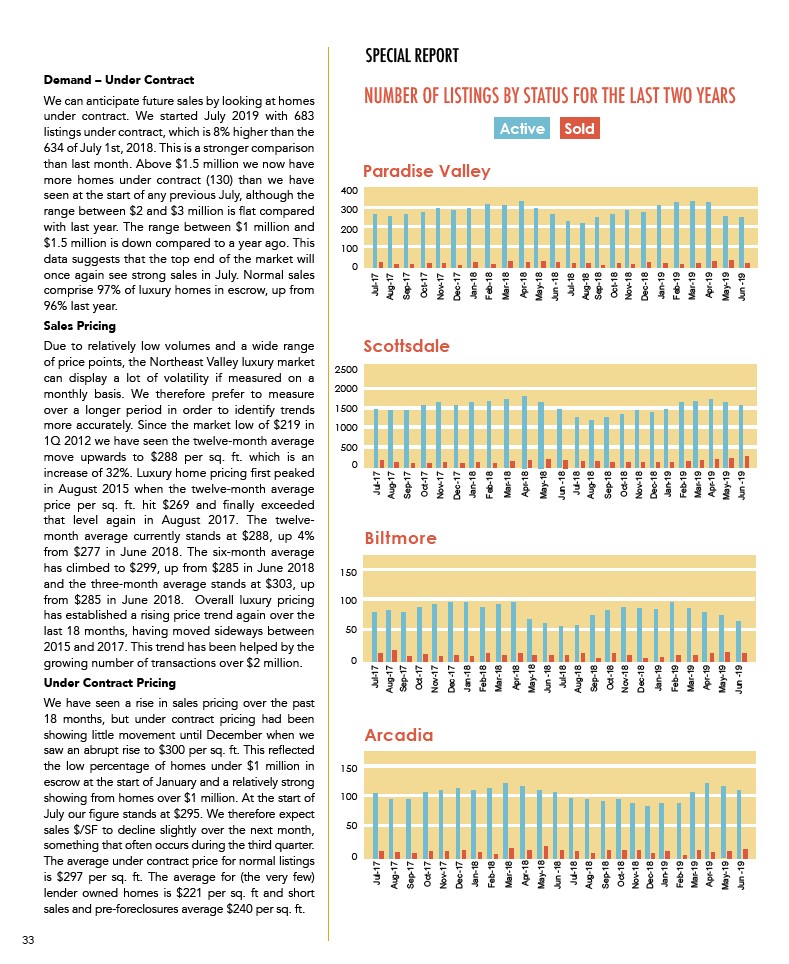
NUMBER OF LISTINGS BY STATUS FOR THE LAST TWO YEARS
Active Sold
Demand – Under Contract
We can anticipate future sales by looking at homes
under contract. We started July 2019 with 683
listings under contract, which is 8% higher than the
634 of July 1st, 2018. This is a stronger comparison
than last month. Above $1.5 million we now have
more homes under contract (130) than we have
seen at the start of any previous July, although the
range between $2 and $3 million is flat compared
with last year. The range between $1 million and
$1.5 million is down compared to a year ago. This
data suggests that the top end of the market will
once again see strong sales in July. Normal sales
comprise 97% of luxury homes in escrow, up from
96% last year.
Sales Pricing
Due to relatively low volumes and a wide range
of price points, the Northeast Valley luxury market
can display a lot of volatility if measured on a
monthly basis. We therefore prefer to measure
over a longer period in order to identify trends
more accurately. Since the market low of $219 in
1Q 2012 we have seen the twelve-month average
move upwards to $288 per sq. ft. which is an
increase of 32%. Luxury home pricing first peaked
in August 2015 when the twelve-month average
price per sq. ft. hit $269 and finally exceeded
that level again in August 2017. The twelvemonth
average currently stands at $288, up 4%
from $277 in June 2018. The six-month average
has climbed to $299, up from $285 in June 2018
and the three-month average stands at $303, up
from $285 in June 2018. Overall luxury pricing
has established a rising price trend again over the
last 18 months, having moved sideways between
2015 and 2017. This trend has been helped by the
growing number of transactions over $2 million.
Under Contract Pricing
We have seen a rise in sales pricing over the past
18 months, but under contract pricing had been
showing little movement until December when we
saw an abrupt rise to $300 per sq. ft. This reflected
the low percentage of homes under $1 million in
escrow at the start of January and a relatively strong
showing from homes over $1 million. At the start of
July our figure stands at $295. We therefore expect
sales $/SF to decline slightly over the next month,
something that often occurs during the third quarter.
The average under contract price for normal listings
is $297 per sq. ft. The average for (the very few)
lender owned homes is $221 per sq. ft and short
sales and pre-foreclosures average $240 per sq. ft.
Paradise Valley
400
300
200
100
0
Jul-18
Aug-18
Sep-18
Oct-18
Feb-19
May-19
Jun -19
Mar-19
Apr-19
Jul-17
Aug-17
Sep-17
Oct-17
Nov-17
Dec-17
Jan-18
Feb-18
May-18
Jun -18
Mar-18
Apr-18
May-19
Jun -19
Jul-18
Aug-18
Sep-18
Oct-18
Nov-18
Dec-18
Jan-19
Dec-18
Jan-19
Feb-19
Mar-19
Apr-19
Arcadia
Jul-17
Aug-17
Sep-17
Oct-17
Nov-17
150
100
50
0
Dec-17
Jan-18
Feb-18
May-18
Jun -18
Mar-18
Apr-18
Scottsdale
2500
2000
1500
1000
500
0
Jul-18
Aug-18
Sep-18
Oct-18
Dec-18
Jan-19
Feb-19
May-19
Jun -19
Mar-19
Apr-19
Jul-17
Aug-17
Sep-17
Oct-17
Nov-17
Dec-17
Jan-18
Feb-18
May-18
Jun -18
Mar-18
Apr-18
Nov-18
Jul-18
Aug-18
Sep-18
Oct-18
Dec-18
Jan-19
Feb-19
May-19
Jun -19
Mar-19
Apr-19
Jul-17
Aug-17
Sep-17
Oct-17
Nov-17
Dec-17
Jan-18
Feb-18
May-18
Jun -18
Mar-18
Apr-18
Nov-18
Biltmore
150
100
50
0
Nov-18