32
SPECIAL REPORT
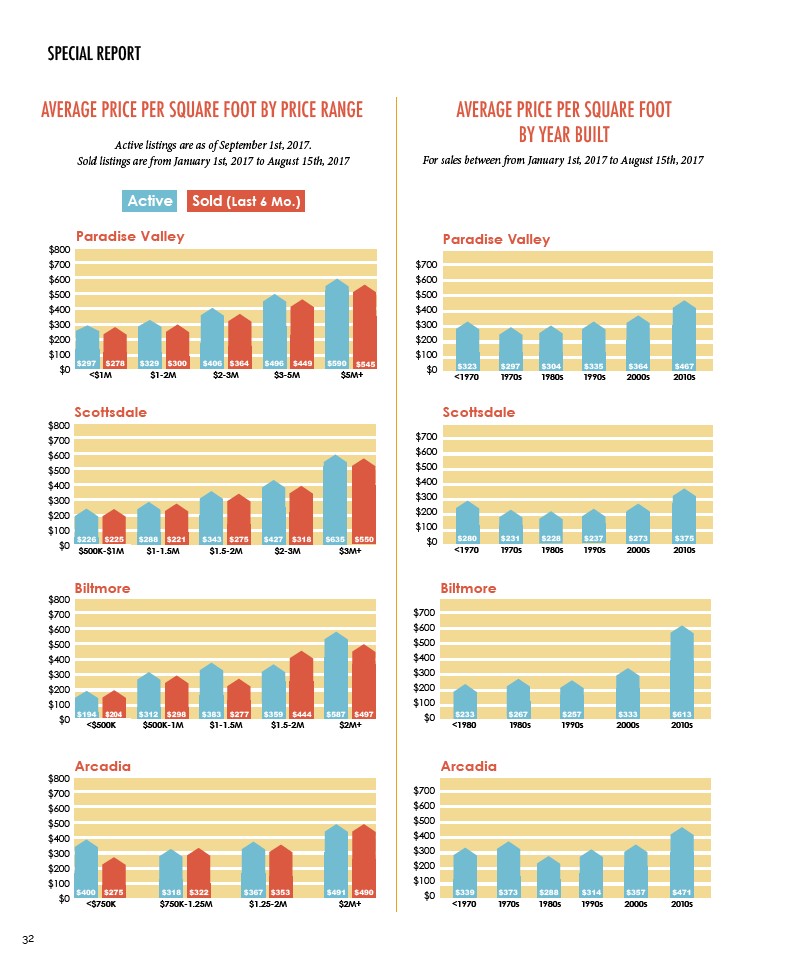
AVERAGE PRICE PER SQUARE FOOT BY PRICE RANGE
Active listings are as of September 1st, 2017.
Sold listings are from January 1st, 2017 to August 15th, 2017
Active Sold (Last 6 Mo.)
AVERAGE PRICE PER SQUARE FOOT
BY YEAR BUILT
For sales between from January 1st, 2017 to August 15th, 2017
Paradise Valley
$278 $545
Scottsdale
$800
$700
$600
$500
$400
$300
$200
$100
$0 $1-1.5M $1.5-2M $2-3M $3M+
$226 $225 $288 $221 $343 $275 $427 $318 $550
$500K-$1M
Biltmore
$800
$700
$600
$500
$400
$300
$200
$100
$0 $194 $204 $312 $298 $383 $277 $359 $587
<$500K
$500K-1M $1-1.5M $1.5-2M $2M+
$497
$800
$700
$600
$500
$400
$300
$200
$100
$318 $322
$0 $750K-1.25M
$367 $353
$1.25-2M
$491 $490
$2M+
Arcadia
$400
<$750K
$275
$700
$600
$500
$400
$300
$200
$100
$0
Paradise Valley
$323 $297 $304 $335
$228
$288
1980s
$314
$257
1990s
$364
$273
$333
$357
2000s
$233 $267
Arcadia
$467
$375
$613
$471
$339 $373
<1970 2010s
1970s
$700
$600
$500
$400
$300
$200
$100
$0
1990s
2000s
Biltmore
<1980 2010s
1980s
$700
$600
$500
$400
$300
$200
$100
$0
1980s
1990s 2000s
Scottsdale
<1970 2010s
1970s
$280
$700
$600
$500
$400
$300
$200
$100
$0
1980s 1990s 2000s
<1970 2010s
1970s
$231 $237
$800
$700
$600
$500
$400
$300
$200
$100
$297 $329 $300 $406 $364 $496 $449 $590
$0 <$1M $1-2M $2-3M $3-5M $5M+
$444
$635