31
SPECIAL REPORT
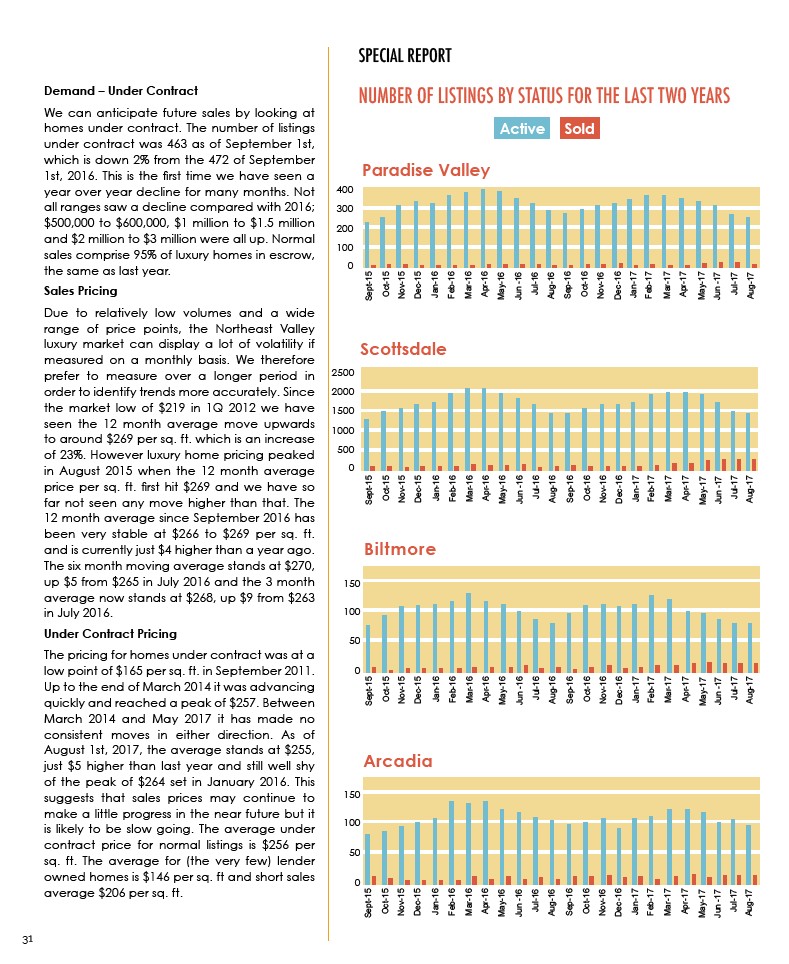
NUMBER OF LISTINGS BY STATUS FOR THE LAST TWO YEARS
Active Sold
Demand – Under Contract
We can anticipate future sales by looking at
homes under contract. The number of listings
under contract was 463 as of September 1st,
which is down 2% from the 472 of September
1st, 2016. This is the first time we have seen a
year over year decline for many months. Not
all ranges saw a decline compared with 2016;
$500,000 to $600,000, $1 million to $1.5 million
and $2 million to $3 million were all up. Normal
sales comprise 95% of luxury homes in escrow,
the same as last year.
Sales Pricing
Due to relatively low volumes and a wide
range of price points, the Northeast Valley
luxury market can display a lot of volatility if
measured on a monthly basis. We therefore
prefer to measure over a longer period in
order to identify trends more accurately. Since
the market low of $219 in 1Q 2012 we have
seen the 12 month average move upwards
to around $269 per sq. ft. which is an increase
of 23%. However luxury home pricing peaked
in August 2015 when the 12 month average
price per sq. ft. first hit $269 and we have so
far not seen any move higher than that. The
12 month average since September 2016 has
been very stable at $266 to $269 per sq. ft.
and is currently just $4 higher than a year ago.
The six month moving average stands at $270,
up $5 from $265 in July 2016 and the 3 month
average now stands at $268, up $9 from $263
in July 2016.
Under Contract Pricing
The pricing for homes under contract was at a
low point of $165 per sq. ft. in September 2011.
Up to the end of March 2014 it was advancing
quickly and reached a peak of $257. Between
March 2014 and May 2017 it has made no
consistent moves in either direction. As of
August 1st, 2017, the average stands at $255,
just $5 higher than last year and still well shy
of the peak of $264 set in January 2016. This
suggests that sales prices may continue to
make a little progress in the near future but it
is likely to be slow going. The average under
contract price for normal listings is $256 per
sq. ft. The average for (the very few) lender
owned homes is $146 per sq. ft and short sales
average $206 per sq. ft.
Paradise Valley
Biltmore
400
300
200
100
0
Nov-15
Dec-15
Jan-16
May-16
Jun -16
Jul-16
Aug-16
Oct-15
Sept-15
Feb-16
Mar-16
Apr-16
Sep-16
Oct-16
Nov-16
Dec-16
Jan-17
Feb-17
May-17
Jun -17
Mar-17
Apr-17
Jul-17
Aug-17
Scottsdale
2500
2000
1500
1000
500
0
Nov-15
Dec-15
Jan-16
May-16
Jun -16
Jul-16
Aug-16
Oct-15
Sept-15
Feb-16
Mar-16
Apr-16
Sep-16
Oct-16
Nov-16
Dec-16
Jan-17
Feb-17
May-17
Jun -17
Mar-17
Apr-17
Jul-17
Aug-17
150
100
50
0
Nov-15
Dec-15
Jan-16
May-16
Jun -16
Jul-16
Aug-16
Oct-15
Sept-15
Feb-16
Mar-16
Apr-16
Sep-16
Oct-16
Nov-16
Dec-16
Jan-17
Feb-17
May-17
Jun -17
Mar-17
Apr-17
Jul-17
Aug-17
Arcadia
150
100
50
0
Nov-15
Dec-15
Jan-16
May-16
Jun -16
Jul-16
Aug-16
Oct-15
Sept-15
Feb-16
Mar-16
Apr-16
Sep-16
Oct-16
Nov-16
Dec-16
Jan-17
Feb-17
May-17
Jun -17
Mar-17
Apr-17
Jul-17
Aug-17