33
SPECIAL REPORT
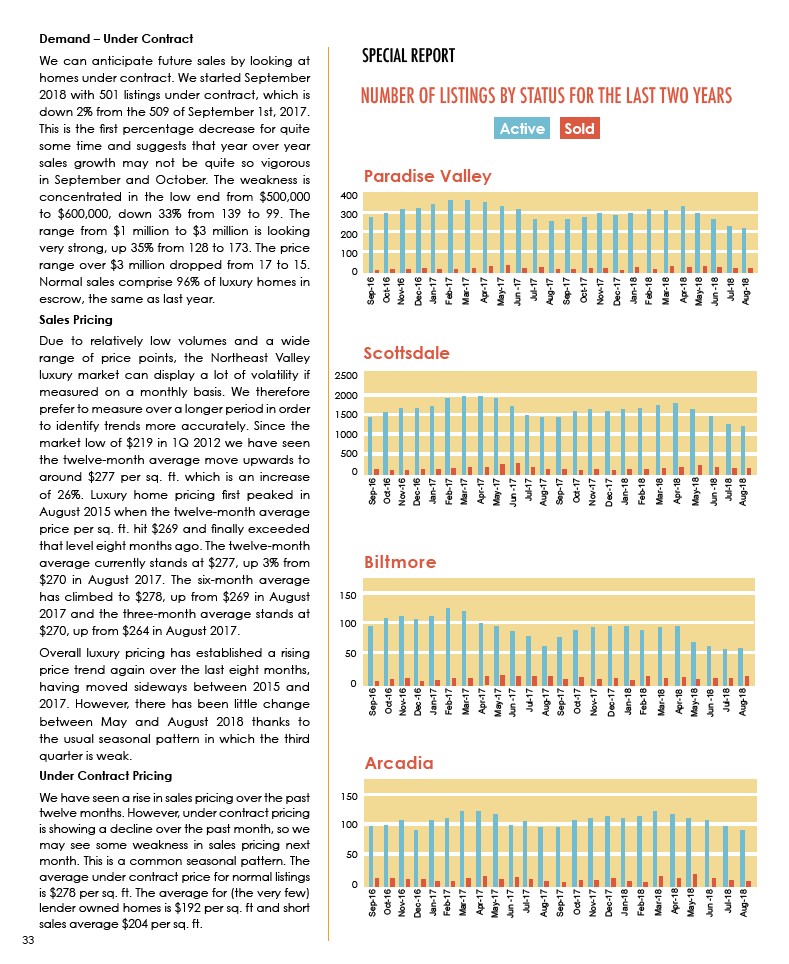
NUMBER OF LISTINGS BY STATUS FOR THE LAST TWO YEARS
Active Sold
Demand – Under Contract
We can anticipate future sales by looking at
homes under contract. We started September
2018 with 501 listings under contract, which is
down 2% from the 509 of September 1st, 2017.
This is the first percentage decrease for quite
some time and suggests that year over year
sales growth may not be quite so vigorous
in September and October. The weakness is
concentrated in the low end from $500,000
to $600,000, down 33% from 139 to 99. The
range from $1 million to $3 million is looking
very strong, up 35% from 128 to 173. The price
range over $3 million dropped from 17 to 15.
Normal sales comprise 96% of luxury homes in
escrow, the same as last year.
Sales Pricing
Due to relatively low volumes and a wide
range of price points, the Northeast Valley
luxury market can display a lot of volatility if
measured on a monthly basis. We therefore
prefer to measure over a longer period in order
to identify trends more accurately. Since the
market low of $219 in 1Q 2012 we have seen
the twelve-month average move upwards to
around $277 per sq. ft. which is an increase
of 26%. Luxury home pricing first peaked in
August 2015 when the twelve-month average
price per sq. ft. hit $269 and finally exceeded
that level eight months ago. The twelve-month
average currently stands at $277, up 3% from
$270 in August 2017. The six-month average
has climbed to $278, up from $269 in August
2017 and the three-month average stands at
$270, up from $264 in August 2017.
Overall luxury pricing has established a rising
price trend again over the last eight months,
having moved sideways between 2015 and
2017. However, there has been little change
between May and August 2018 thanks to
the usual seasonal pattern in which the third
quarter is weak.
Under Contract Pricing
We have seen a rise in sales pricing over the past
twelve months. However, under contract pricing
is showing a decline over the past month, so we
may see some weakness in sales pricing next
month. This is a common seasonal pattern. The
average under contract price for normal listings
is $278 per sq. ft. The average for (the very few)
lender owned homes is $192 per sq. ft and short
sales average $204 per sq. ft.
Paradise Valley
400
300
200
100
0
Jul-18
Aug-18
Sep-16
Oct-16
Nov-16
Dec-16
Jan-17
Feb-17
May-17
Jun -17
Mar-17
Apr-17
Jul-17
Aug-17
Sep-17
Oct-17
Nov-17
Dec-17
Jan-18
Feb-18
May-18
Jun -18
Mar-18
Apr-18
Scottsdale
2500
2000
1500
1000
500
0
Jul-18
Aug-18
Sep-16
Oct-16
Nov-16
Dec-16
Jan-17
Feb-17
May-17
Jun -17
Mar-17
Apr-17
Jul-17
Aug-17
Sep-17
Oct-17
Nov-17
Dec-17
Jan-18
Feb-18
May-18
Jun -18
Mar-18
Apr-18
Jul-18
Aug-18
Sep-16
Oct-16
Nov-16
Dec-16
Jan-17
Feb-17
May-17
Jun -17
Mar-17
Apr-17
Jul-17
Aug-17
Sep-17
Oct-17
Nov-17
Biltmore
150
100
50
0
Dec-17
Jan-18
Feb-18
May-18
Jun -18
Mar-18
Apr-18
Jul-18
Aug-18
Sep-16
Oct-16
Nov-16
Dec-16
Jan-17
Feb-17
May-17
Jun -17
Mar-17
Apr-17
Jul-17
Aug-17
Sep-17
Oct-17
Nov-17
Arcadia
150
100
50
0
Dec-17
Jan-18
Feb-18
May-18
Jun -18
Mar-18
Apr-18