34
SPECIAL REPORT
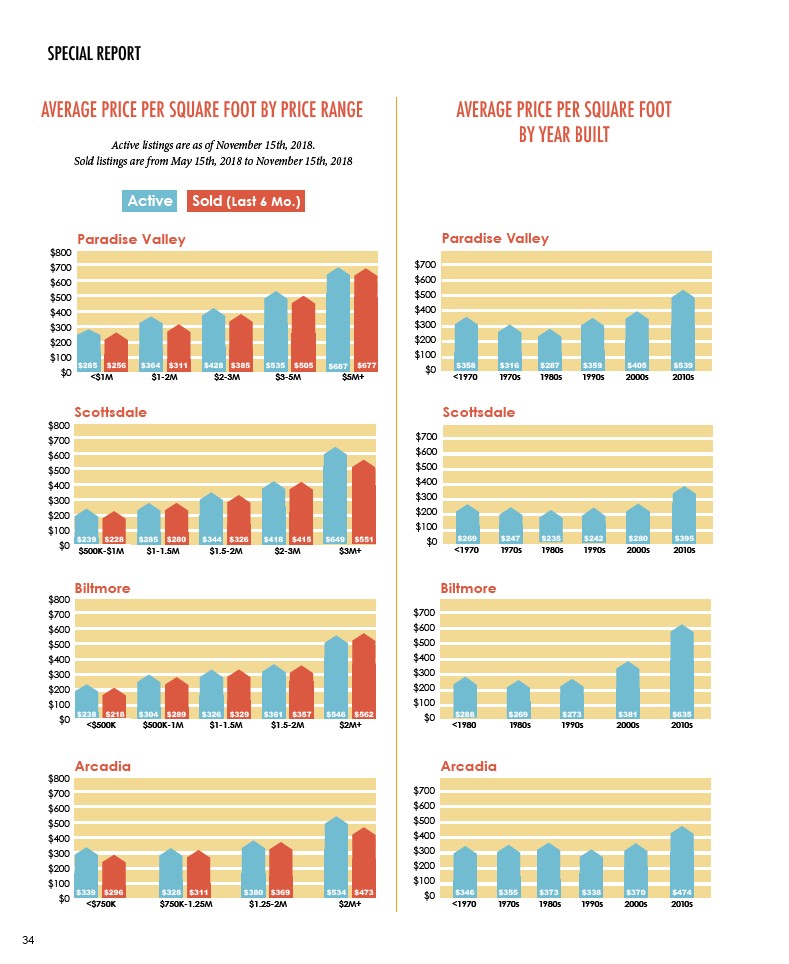
AVERAGE PRICE PER SQUARE FOOT BY PRICE RANGE AVERAGE PRICE PER SQUARE FOOT
Active listings are as of November 15th, 2018.
Sold listings are from May 15th, 2018 to November 15th, 2018
Active Sold (Last 6 Mo.)
BY YEAR BUILT
$800
$700
$600
$500
$400
$300
$200
$100
$285 $364 $311 $428 $385 $535 $505 $687
$0 <$1M $1-2M $2-3M $3-5M $5M+
Scottsdale
$800
$700
$600
$500
$400
$300
$200
$100
$0 $1-1.5M $1.5-2M $2-3M $3M+
$239 $228 $285 $280 $344 $326 $418 $415 $551
$500K-$1M
Biltmore
$800
$700
$600
$500
$400
$300
$200
$100
$0 $238 $218 $304 $289 $326 $329 $361 $546
<$500K
$500K-1M $1-1.5M $1.5-2M $2M+
$562
$800
$700
$600
$500
$400
$300
$200
$100
$328 $311
$0 $750K-1.25M
$380 $369
$1.25-2M
$534 $473
$2M+
Arcadia
$339
<$750K
$296
$700
$600
$500
$400
$300
$200
$100
$0
Paradise Valley
$358 $316 $287 $359
$269 $247 $235
$242
$373
1980s
$338
$273
1990s
$405
$280
$381
$370
2000s
$288 $269
Arcadia
$539
$395
$635
$474
$346 $355
<1970 2010s
1970s
$700
$600
$500
$400
$300
$200
$100
$0
1990s
2000s
Biltmore
<1980 2010s
1980s
$700
$600
$500
$400
$300
$200
$100
$0
1980s
1990s 2000s
Scottsdale
<1970 2010s
1970s
$357
$649
Paradise Valley
$256 $677
$700
$600
$500
$400
$300
$200
$100
$0
1980s 1990s 2000s
<1970 2010s
1970s