33
SPECIAL REPORT
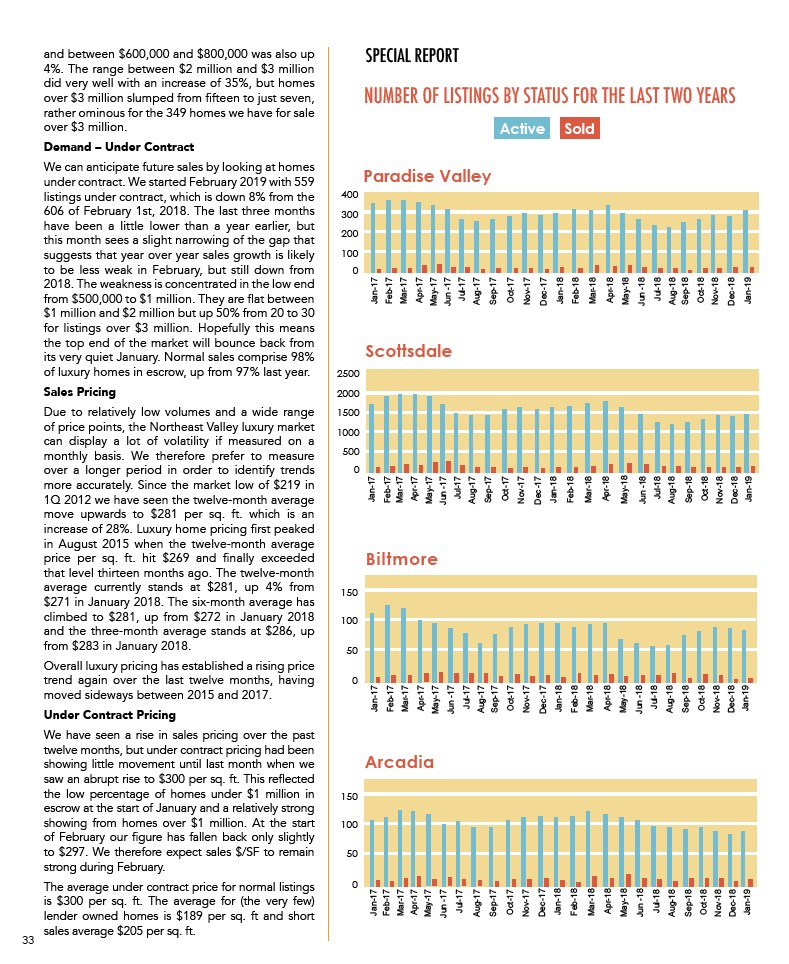
NUMBER OF LISTINGS BY STATUS FOR THE LAST TWO YEARS
Active Sold
and between $600,000 and $800,000 was also up
4%. The range between $2 million and $3 million
did very well with an increase of 35%, but homes
over $3 million slumped from fifteen to just seven,
rather ominous for the 349 homes we have for sale
over $3 million.
Demand – Under Contract
We can anticipate future sales by looking at homes
under contract. We started February 2019 with 559
listings under contract, which is down 8% from the
606 of February 1st, 2018. The last three months
have been a little lower than a year earlier, but
this month sees a slight narrowing of the gap that
suggests that year over year sales growth is likely
to be less weak in February, but still down from
2018. The weakness is concentrated in the low end
from $500,000 to $1 million. They are flat between
$1 million and $2 million but up 50% from 20 to 30
for listings over $3 million. Hopefully this means
the top end of the market will bounce back from
its very quiet January. Normal sales comprise 98%
of luxury homes in escrow, up from 97% last year.
Sales Pricing
Due to relatively low volumes and a wide range
of price points, the Northeast Valley luxury market
can display a lot of volatility if measured on a
monthly basis. We therefore prefer to measure
over a longer period in order to identify trends
more accurately. Since the market low of $219 in
1Q 2012 we have seen the twelve-month average
move upwards to $281 per sq. ft. which is an
increase of 28%. Luxury home pricing first peaked
in August 2015 when the twelve-month average
price per sq. ft. hit $269 and finally exceeded
that level thirteen months ago. The twelve-month
average currently stands at $281, up 4% from
$271 in January 2018. The six-month average has
climbed to $281, up from $272 in January 2018
and the three-month average stands at $286, up
from $283 in January 2018.
Overall luxury pricing has established a rising price
trend again over the last twelve months, having
moved sideways between 2015 and 2017.
Under Contract Pricing
We have seen a rise in sales pricing over the past
twelve months, but under contract pricing had been
showing little movement until last month when we
saw an abrupt rise to $300 per sq. ft. This reflected
the low percentage of homes under $1 million in
escrow at the start of January and a relatively strong
showing from homes over $1 million. At the start
of February our figure has fallen back only slightly
to $297. We therefore expect sales $/SF to remain
strong during February.
The average under contract price for normal listings
is $300 per sq. ft. The average for (the very few)
lender owned homes is $189 per sq. ft and short
sales average $205 per sq. ft.
Paradise Valley
400
300
200
100
0
Jul-18
Aug-18
Sep-18
Oct-18
Jan-17
Feb-17
May-17
Jun -17
Mar-17
Apr-17
Jul-17
Aug-17
Sep-17
Oct-17
Nov-17
Dec-17
Jan-18
Feb-18
May-18
Jun -18
Mar-18
Apr-18
Jul-18
Aug-18
Sep-18
Oct-18
Dec-18
Jan-19
Jan-17
Feb-17
May-17
Jun -17
Mar-17
Apr-17
Jul-17
Aug-17
Sep-17
Oct-17
Nov-17
Arcadia
150
100
50
0
Mar-18
Apr-18 Scottsdale
Dec-17
Jan-18
Feb-18
May-18
Jun -18
2500
2000
1500
1000
500
0
Jul-18
Aug-18
Sep-18
Oct-18
Dec-18
Jan-19
Jan-17
Feb-17
May-17
Jun -17
Mar-17
Apr-17
Jul-17
Aug-17
Sep-17
Oct-17
Nov-17
Dec-17
Jan-18
Feb-18
May-18
Jun -18
Mar-18
Apr-18
Nov-18
Jul-18
Aug-18
Sep-18
Oct-18
Dec-18
Jan-19
Jan-17
Feb-17
May-17
Jun -17
Mar-17
Apr-17
Jul-17
Aug-17
Sep-17
Oct-17
Nov-17
Dec-17
Jan-18
Feb-18
May-18
Jun -18
Mar-18
Apr-18
Nov-18
Biltmore
150
100
50
0
Nov-18 Nov-18
Dec-18
Jan-19